This document introduces the basic concepts of various Web performance timing specifications, including [[PERFORMANCE-TIMELINE-2]], [[HR-TIME-2]], [[NAVIGATION-TIMING-2]], [[RESOURCE-TIMING]], [[USER-TIMING]], [[FRAME-TIMING]], [[SERVER-TIMING]], and explains how these APIs fit together.
Imagine you're visiting our W3C website, if the web content doesn't show up in the screen within a certain number of seconds, as a user, perhaps you will just close the tab and head to alternatives. However, as a developer, you might hope to trace the hints in the requests and navigation details, so that you can find out what's slowing down this webpage.
Fortunately, most browser vendors are willing to expose performance characteristics that allow developers to collect accurate performance details. These performance timing APIs, as their names suggest, are very helpful to identify the bottlenecks of the web applications from different aspects and improve the performance.
A Waterfall Chart generated with Page Load Waterfalls, which is using the Resource Timing API
Waterfall charts may be the first tool you'll think of when trying to understand the performance of your web applications. Have you ever wondered about the magic behind these graphic charts? In the following sections, we are going to explain a set of performance monitoring APIs that allow you to do more than a waterfall chart measurement.
Resource Timing
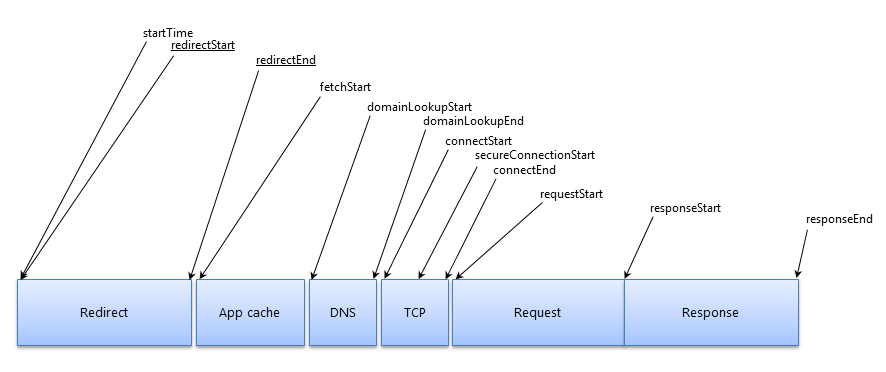
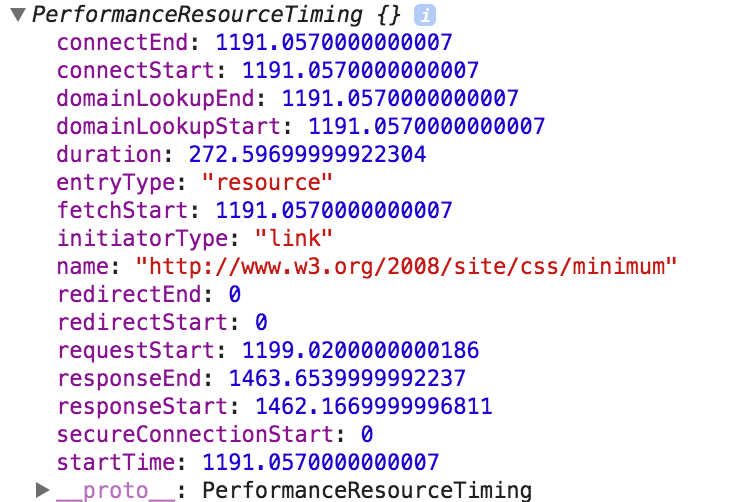
Fig.1 is a waterfall chart for the timing data for each loaded resource of a simple webpage. Actually, the [[RESOURCE-TIMING]] API can provide much more detail information than this. Fig.2 is a set of attributes that developers are able to access for each loaded resource on their Web applications.
Resource Timing attributes
Load Times for Resources
Web Applications mostly consist of a set of downloadable resources. Here resources usually refer to HTML documents, XHR objects, links (such as a stylesheet) or SVG elements.
The Resources Timing data are exposed as methods on the global window.performance object, which we are going to talk about in the next section. You're encouraged to use the performance.getEntriesByType("resource") method to obtain an array of Resource Timing Objects for each requested resource.
Demo of Resource Timing Details
The PerformanceResourceTiming interface extends the PerformanceEntry interface in the Performance Timeline. The attribute in Resource Timing can be measured as the difference between responseEnd and startTime.
As shown in Fig.2 and Fig.3, you are able to access a set of critical network timing attributes for each resource on the page.
Each of these timestamps is in microseconds, which are provided by the window.performance.now() method in the High Resolution Time specification.
Example
As an example, let's try to measure the time it takes to fetch the icon on the W3C homepage.
<!doctype html>
<html>
  <head>
  </head>
  <body onload="loadResources()">
    <script>
       function loadResources()
       {
          var image1 = new Image();
          image1.onload = resourceTiming;
          image1.src = 'https://www.w3.org/Icons/w3c_main.png';
       }

       function resourceTiming()
       {
           var resourceList = window.performance.getEntriesByType("resource");
           for (var i = 0; i < resourceList.length; i++)
           {
              if (resourceList[i].initiatorType == "img")
              {
                 alert("End to end resource fetch: " + (resourceList[i].responseEnd - resourceList[i].startTime));
              }
           }
       }
    </script>
    <img id="image0" src="https://www.w3.org/Icons/w3c_home.png">
  </body>
</html>
Browser Support
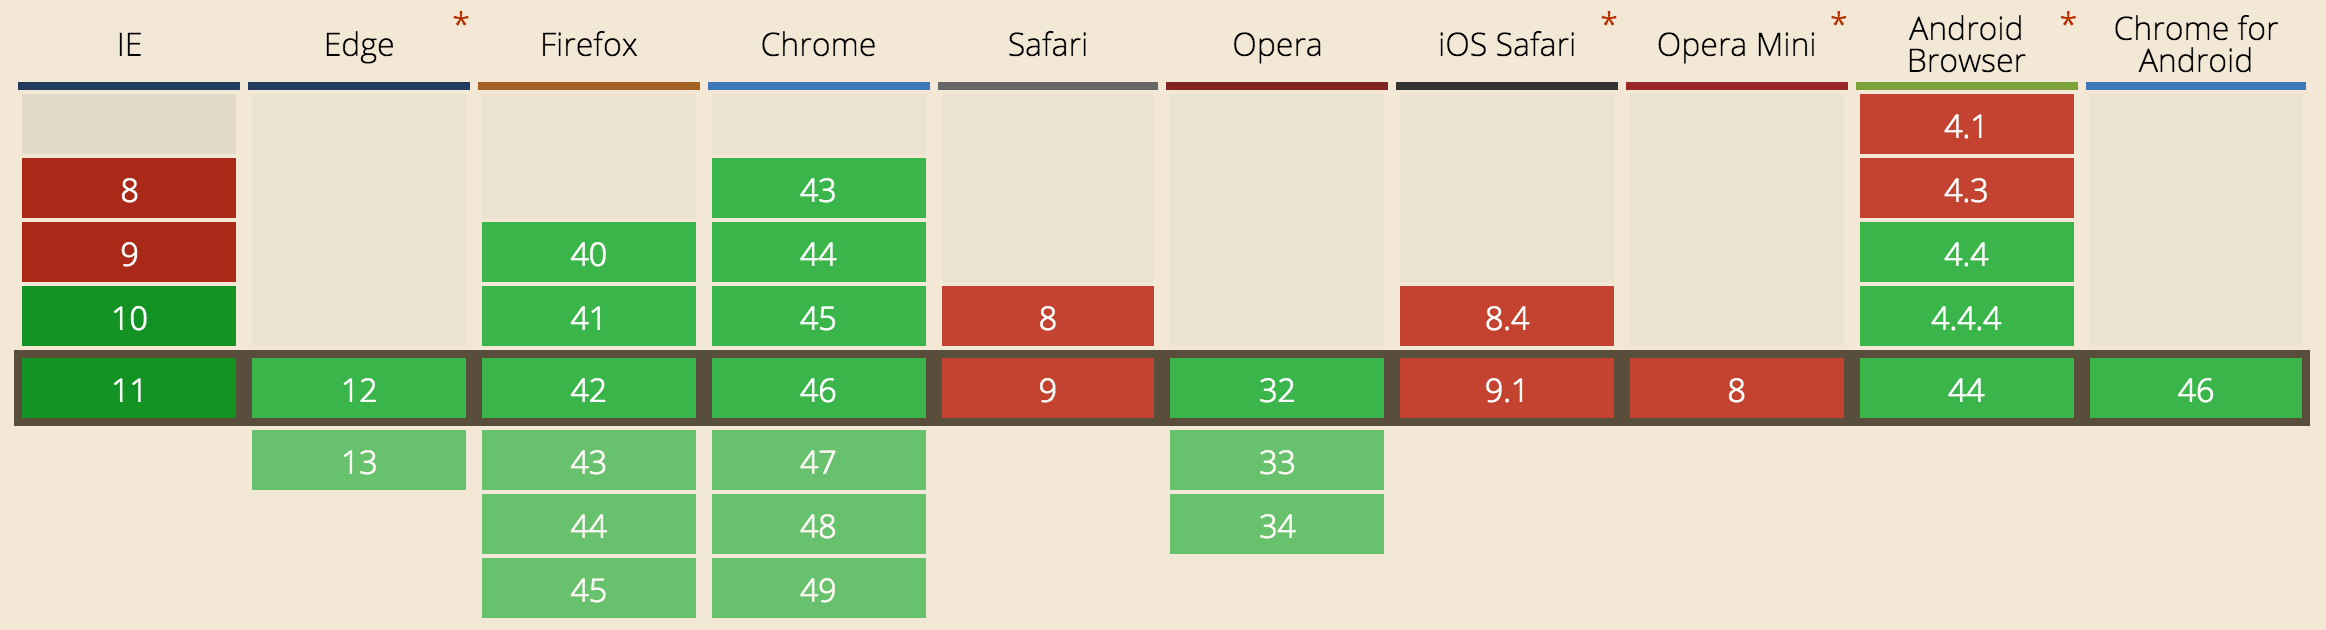
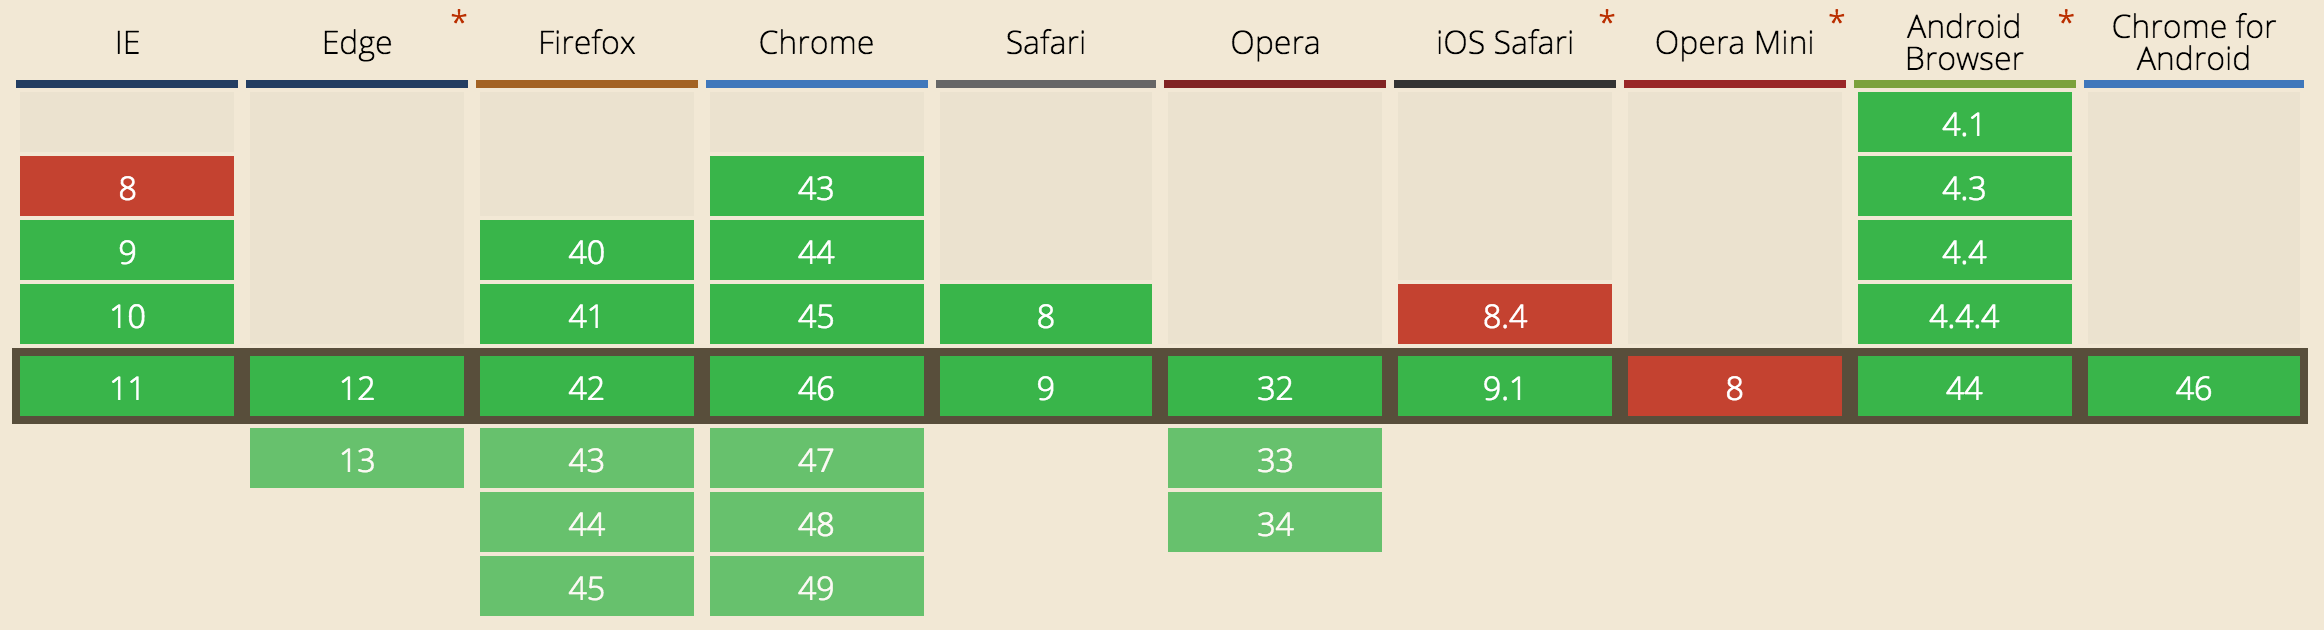
So far, the [[RESOURCE-TIMING]] API has been widely implemented. Fig.4 illustrates the current support data on the major desktop and mobile web browsers, please also visit caniuse.com for the latest status.
Can I use Resource Timing API?
Performance Timeline
Overview
You may already start thinking about, if these timing data of the resources on the webpages are good enough to measure its performance? Right, to understand your web application, it's always necessary to explore more: page navigation, user interaction, request-response cycle, etc. According to this requirement, the Web Performance Working Group introduces Performance Timeline, which is a unified interface to obtain various performance metrics.
EntryType
The Performance Timeline API uses PerformanceEntry.entryType to describe the type of the interface represented by this PerformanceEntry object, which represents performance measurements.
 var entryType = performance.getEntries()[0].entryType
// Entry Type
Each of the PerformanceEntry objects expose the following inherited attributes:
name
A DOMString identifier for this PerformanceEntry object. Not necessarily unique.
entryType
The DOMString that describes the type of the interface represented by this PerformanceEntry object.
startTime
A DOMHighResTimeStamp that contains the time value of the first recorded timestamp of this performance metric.
duration
A DOMHighResTimeStamp that contains the time value of the duration of the entire event being recorded by this PerformanceEntry.
The W3C WebPerf WG maintains a list of the known values for PerformanceEntry.entryType.
All of the metrics that participate in the Performance Timeline are able to provides timing data in sub-millisecond resolution, i.e. in DOMHighResTimeStamp, which is defined by the High Resolution Time specification [[HR-TIME-2]].
Monotonic Clock
In early stages of design, our Timing APIs were defined in terms of wall-clock epoch times. Unfortunately, such times on modern computer system have an unpleasant property: they are not monotonically increasing at the rate at which time actually passes. In particular, NTP adjustments, leap seconds, user configuration changes, and so forth can cause the epoch time reported by the system to go backwards, go forwards too fast or go forwards too slowly.
For example, a positive number, negative number, or zero may be logged in between the two calls to Date.now().
var mark_start = Date.now();
doTask(); // Some task
if (window.console) window.console.log('Duration of task: ' + (Date.now() - mark_start));
The idea of High Resolution Time is to provide a monotonic, uniformly increasing timestamp suitable for interval measurements, which is made possible based on the following rules:
The time values returned when calling the now() method on {{Performance}} objects with the same time origin MUST be monotonically increasing and not subject to system clock adjustments or system clock skew.
The difference between any two chronologically recorded time values returned from the now() method MUST never be negative if the two time values have the same time origin.
Sub-millisecond Resolution
Date.now() is genuinely useful in determining the current value of the calendar time and has a long history of usage. However, looking longer term, there's a need for more precision.
One example is graphics. When calculating the frame rate of a script based animation, developers will need sub-millisecond resolution in order to determine if an animation is drawing at 60 FPS. Without sub-millisecond resolution, a developer can only determine if an animation is drawing at 58.8 FPS or 62.5 FPS.
The {{DOMHighResTimeStamp}} type and the now() method of the {{Performance}} interface resolve the issues summarized in this section by providing a time value in sub-millisecond resolution.
Time Origin
Time Origin determines the time value from which time is measured. For a dedicated worker or a document the origin time is the start of page navigation of that document, and for a shared worker the origin time is when the shared worker is created. For a more accurate definition, please check the spec's details.
Suppose we have a shared worker A that was created 10ms after the start of navigation of the parent document. If we call performance.now() 5ms after the shared worker A was created in both the worker and the parent context, we should see the following values:
          Shared worker A:
          performance.now(): 5.000 ms

          Parent context:
          performance.now(): 15.000 ms
To display such events on the same timeline, the application can translate the DOMHighResTimeStamps from the worker with the translateTime method.
// ---- worker.js -----------------------------// Shared worker script
onconnect =function(e){var port = e.ports[0];
port.onmessage =function(e){// Time execution in workervar task_start = performance.now();
result = runSomeWorkerTask();var task_end = performance.now();
port.postMessage({'task':'Some worker task','start_time': task_start,'end_time': task_end,'result': result
});}}// ---- application.js ------------------------// Timing tasks in the documentvar task_start = performance.now();
result = runSomeWorkerTask();var task_end = performance.now();
plotEventOnTimeline({'task':'Some document task','start_time': task_start,'end_time': task_end,'result': result
});// Translating worker timestamps into document's time originvar worker =newSharedWorker('worker.js');
worker.port.onmessage =function(event){var msg =event.data;// translate timestamps into document's time origin
msg.start_time = performance.translateTime(msg.start_time, worker);
msg.end_time = performance.translateTime(msg.end_time, worker);// plot the results on document's timeline
plotEventOnTimeline(msg);}
Adding originTime to the performance.now(), gives us a time value that is comparable in either context. Now we would get something like:
          Shared worker A:
          performance.now(): 5.000 ms
          performance.originTime: 110.000 ms
          performance.originTime + performance.now(): 115.000 ms

          Parent context:
          performance.now(): 15.000 ms
          performance.originTime: 100.000 ms
          performance.originTime + performance.now(): 115.000 ms
Navigation Timing
Now that we know how to get timing metrics for individual resources, let's go a step further to access the complete timing information for navigation of a document.
Navigation Timing, Performance Timeline and Resource Timing
Navigation is about how user agents convert the requested HTML, CSS, and JavaScript into rendered pixels, which is one of the most critical steps for users to navigate a document.
Navigation Timing API is the starting point of the Web Performance APIs. In [[NAVIGATION-TIMING]], by accessing window.performance.navigation, you will get an instance of PerformanceNavigationTiming which provides timing-related information about the page’s performance. This doesn't fit in the goal to offer a unified entry by performance.getEntries. By the time Performance Timeline APIs was introduced in 2011, the initial design of Navigation Timing has been widely implemented so it was too late to align it with the Performance Timeline.
Navigation Timing API Level 2 tries to fix this historical bug by an ideal design for Navigation Timing. It participates in the Performance Timeline API, and extends initiatorType and workerStart from the PerformanceResourceTiming interface.
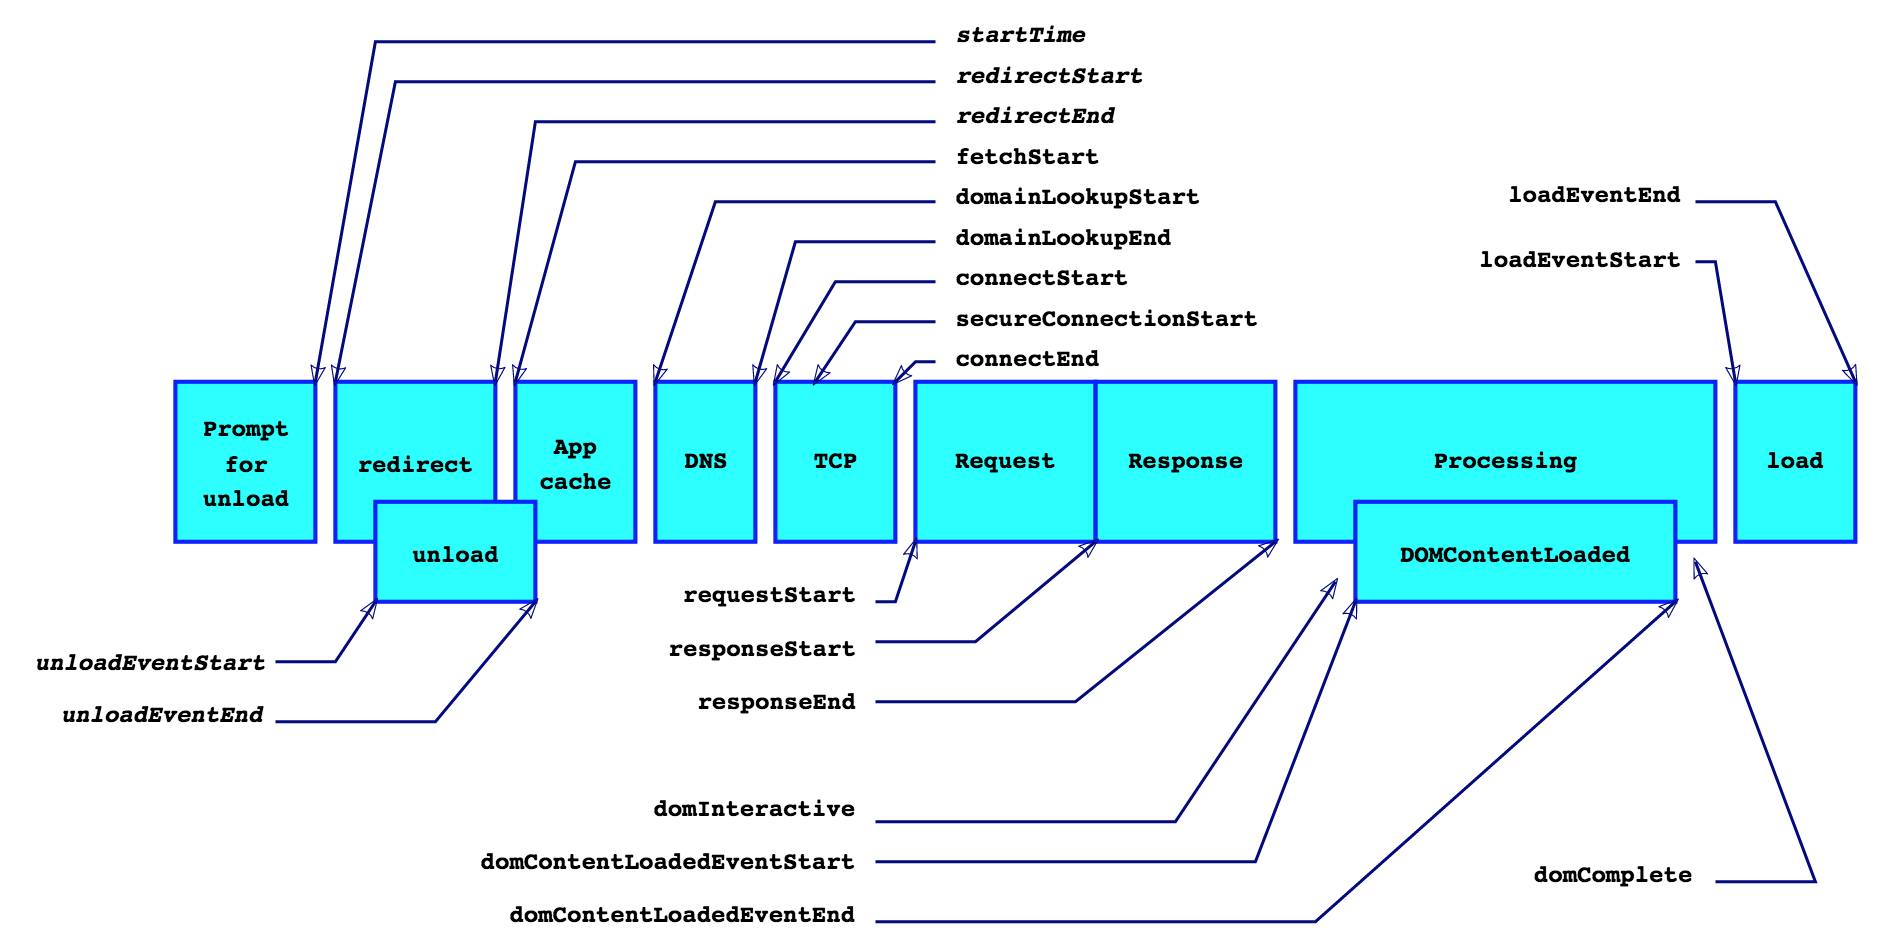
The PerformanceNavigationTiming attributes
Fig.5 displays a list of critical performance characteristics of navigation a page defined in [[NAVIGATION-TIMING-2]].
Navigation Timing Attributes
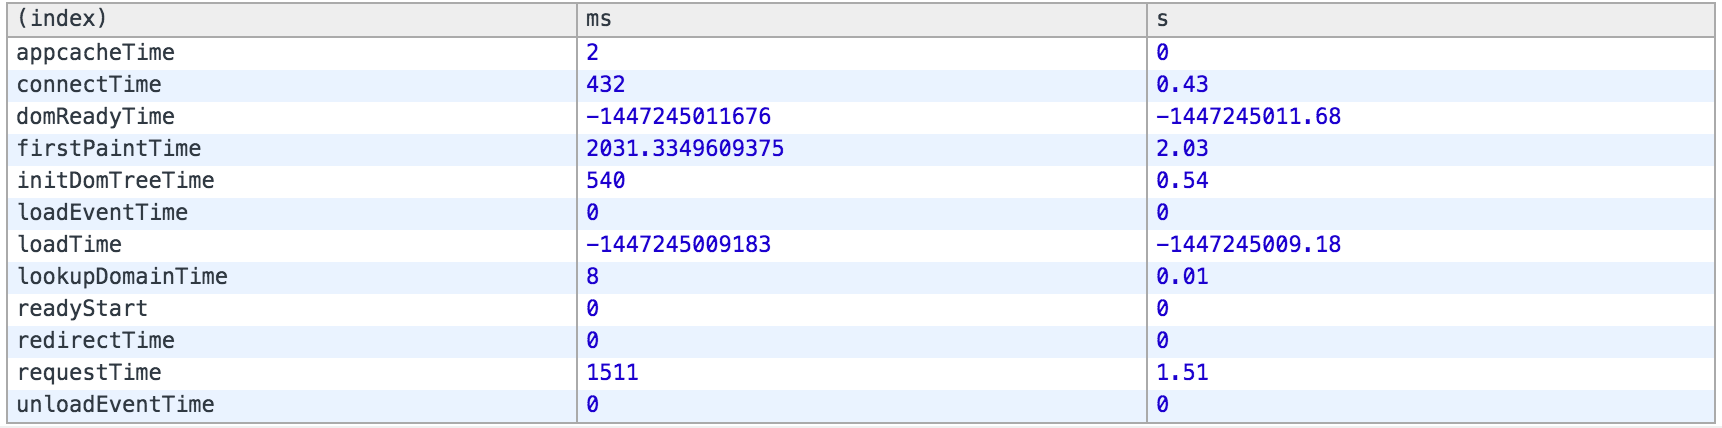
Below is a demo of navigating the www.w3.org webpage.
a demo of Navigation Timing Attrbutes, generated with timing.js.
Browser Support
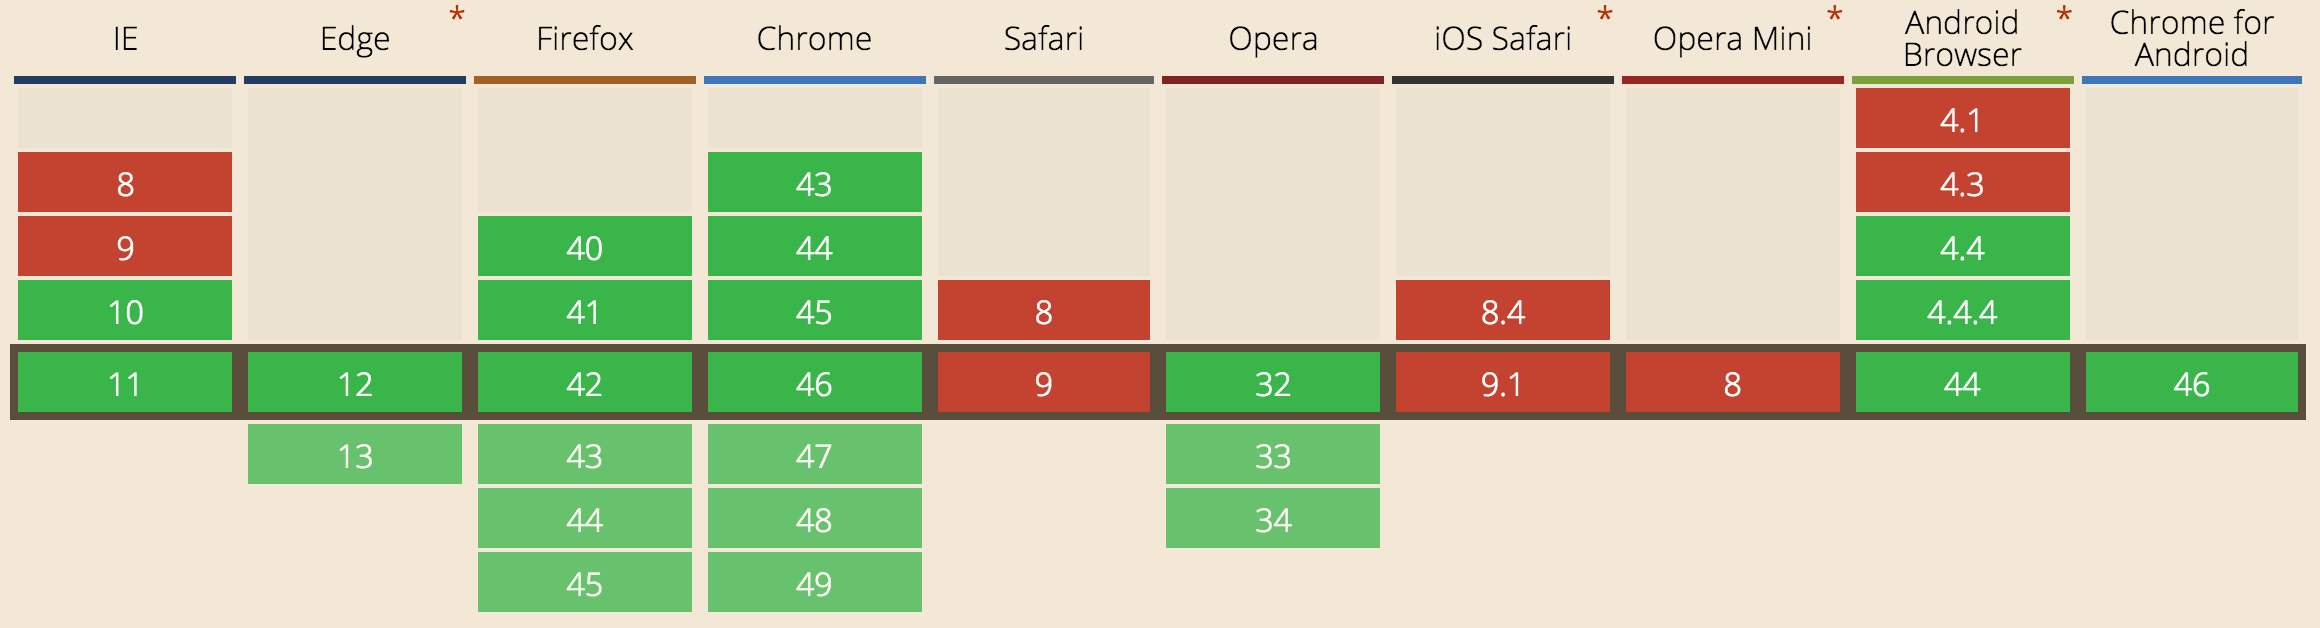
Fig.7 is the support data table for [[NAVIGATION-TIMING]], generated by caniuse.com. If you are curious about the status of the latest Navigation Timing design in Level 2, the Web Performance WG has provided a detailed report (by October 21, 2015) for the latest features in its deliverables.
Can I use Navigation Timing API?
User Timing
Flexible Measurement
So far, with Navigation Timing and Resource Timing, you can sufficiently access the timing information of those critical moments in resource loading and page navigation. However, what if you want to determine what's going wrong with a button-click interaction of your user? Is it possible to obtain the high precision performance characteristics of an individual task which is important to you?
User Timing is an extension to the Performance interface that can help you measure the performance of your applications by providing high precision timestamps.
Here's a simple example that explains how a developer can use the interfaces defined in this document to obtain timing data related to developer scripts.
The PerformanceMark interface extends the Performance interface, and exposes marks to the users by a function named mark().
mark() allows web developers to make unique marks in their web application, and customize the mark with a DOMString markName. For example, to create a mark named before_click, call window.performance.mark('before_click');
You can use the Performance interface to access the marks you have stored. By calling window.performance.getEntriesByType('mark'), you will get a list of all the marks in your application.
When marks are no longer of any value, you can delete them. You can delete all the marks by calling clearMarks() or delete a single mark, mark_to_delete, by calling clearMarks('mark_to_delete').
performance.measure()
When you have prepared enough marks, the PerformanceMeasure interface can help you calculate the elapsed time between two marks. This interface is also an extension of the Performance interface, which exposes measures created via the measure() method. Here, measure() stores the DOMHighResTimeStamp duration between two marks along with the associated name (a "measure"). For example, to measure a successive click, we can call window.performance.measure('measure_click', 'click_before', 'click_after');.
Similar to the PerformanceMark interface, you can get measures by simply calling window.performance.getEntriesByType('measure'), and use clearMeasures() method to delete measures.
Browser Support
Nowadays, you are able to use User Timing API on most of the major browsers. Please visit caniuse.com for the latest browser support information.
Can I use User Timing API?
Roadmap of Performance Monitoring
Current Plan
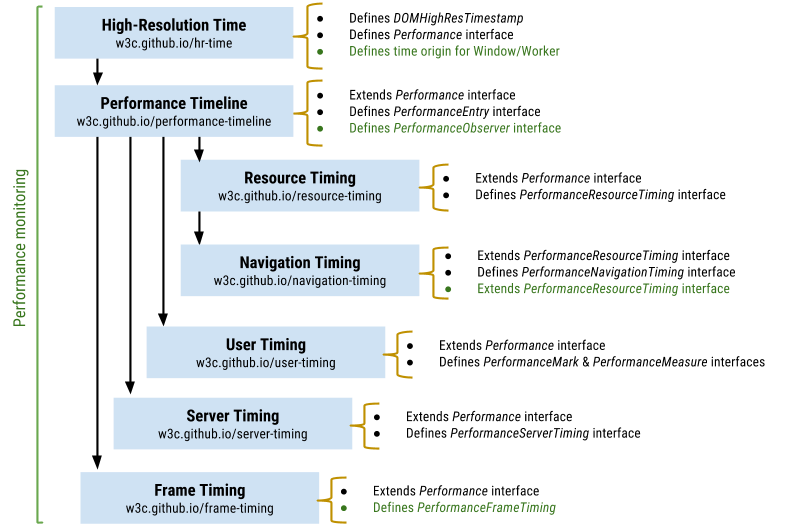
Most of the above Web Performance Timing APIs are still work in progress. Fig.9 is an overview of the current plan of the Performance monitoring specs within the Web Performance Working Group.
This roadmap might already give you some ideas about the potential areas that the WebPerf working group is exploring. In the future, developers will be able to collect much more performance details to improve their user experience.
Server Timing
[[SERVER-TIMING]] is an attempt to address the concern about lacking insight into how or why certain stages of the request-response cycle have taken as much time as they have - e.g. how the request was routed, where the time was spent on the server, and so on. This API defines a mechanism that enables the server to communicate performance metrics about the request-response cycle to the user agent, and a JavaScript interface to enable applications to collect, process, and act on these metrics to optimize application delivery.
Being designed for the communication from server to the client, Server Timing consists of two parts: a definition of the Server-Timing header field and a PerformanceServerTiming interface which participates in the [[PERFORMANCE-TIMELINE-2]]. More details and use cases can be found in the spec ([[SERVER-TIMING]]).
Frame Timing
The idea of a "frame" comes from the event loop of the browser processing model. To provide an interactive user experience, the browser processing model runs a continuous event loop at a certain update frequency - e.g. 60Hz refresh rate. If all of the work within each execution of the event loop (i.e. within a "frame") is completed in the allotted time budget (e.g. 16.6ms for 60Hz refresh rate), the smoothness will meet the user's expectation. Otherwise, if one or more frames are skipped, it will result in inconsistent response, processing, and rendering times, which hurts the user experience.
The Frame Timing API is very helpful to developers who want to deliver a smooth and responsive user experience. It defines an interface for web applications to access runtime performance information of the browser event loop, enabling them to identify and fix issues that cause delayed rendering, processing of input, and other critical work necessary to deliver a smooth and responsive user experience.
This API also participates in the [[PERFORMANCE-TIMELINE-2]], with a entryType value as "frame".
PerformanceObserver
Resource Timing and User Timing have been useful to provide performance data, but in some occasions, it's tricky to make use of this data if there's no notification when new performance entries have been recorded.
In [[PERFORMANCE-TIMELINE-2]], the PerformanceObserver interface was introduced to solve this problem. This interface makes it possible to subscribe to / observe new performance events delivered into the Performance Timeline.
Acknowledgments
Special thanks to all the participants of the W3C Web Performance Working Group for their brilliant ideas to make the Web faster.
We're also grateful to the contributors on GitHub who made this document more readable, and helped to keep this primer in sync with those specs still work in progress.