Participants
- Yoav Weiss, Amiya Gupta, Andy Stewart, Ansh Mishra, Avi Wolicki, Ben Harding, Benjamin De Kosnik, Michal Mocny, Mike Henninger, Philip Tellis, Rafael Lebre, Sia Karamalegos, Timo Tjihof, Nic Jansma, Abhishek Ghosh, Amiya Gupta, Andy Lurhs, Barry Poland, Carine Bournez, Patricija Cerkaite
Admin
- TPAC 2023 Agenda
- Tracking doc for TPAC’s agenda
- Start collecting names for folks attending in person or remotely
- Also add topics to discuss or presentations
- We’ll be meeting Monday/Tuesday/Thursday/Friday
- Non-early bird pricing is on and prices go up soonish
- Hotels are also filling up
- Next call - Aug 3 (no agenda currently)
- Consider skipping it, but let us know if there’s something to discuss
Minutes
Canva and WebPerf API
Andy: Work on the performance team at Canva
Ben: same
Andy: here to talk about how we measure performance at Canva
… Canva is an online design tool enabling sharing and collaboration
… Split into multiple SPAs. Each page has its own domain - login, design, editor
… Single FE codebase for desktop and mobile and also used as a webview for mobile apps
… Applications deal with 2 kinds of workloads:
… navigation & content management (shorter sessions). Content similar between users
… Editor (very long sessions). Highly interactive. Content varies. Large & complex DOM.
… think about: page load, interactions, crashes
… Working on metrics to drive change - one number, relates to UX and actionable.
… Page load - historically tried to use TTI but found that challenging to move in A/B tests
… Also different pages had different interactivity requirements
… Leaning towards page specific definitions: Element Timing, custom design_interactive, as well as CWVs
… Custom editor metric design_interactive - LCP is not very useful as the editor has many different images, which vary by design chosen. Caused very inconsistent LCP measurements
… Design interactive - marking key stages in the loading of the editor
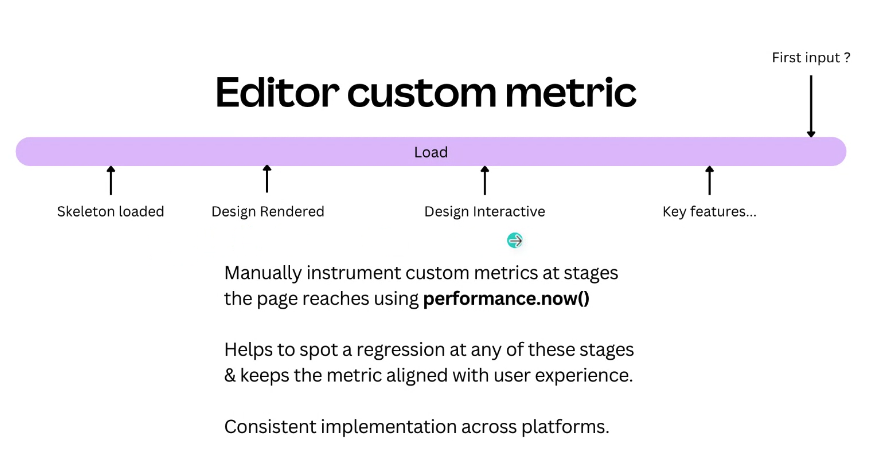
… Using FID to add more details
… It provides a consistent implementation across all platforms, as they control the measurement
Ben: For interactions they split to 2 different sections: per-interaction and session-wide
… Trying to measure the critical user journey. Add marks around when resources load and when things are rendered

… After event handlers they spin off async tasks, and track the actions based on what the user would see
… Hard to say when render is completed. Currently rely on rAF but know that the timings are not necessarily accurate
… Would love more info there
.png)
… They take into account the page’s visibility and count long tasks
… Spans can opt into frame metrics through rAF
.png)
… Interactions come in 2 different flavors - discrete and continuous
.png)
… Continuous is measured with rAFs
.png)
… Q on the best way to define framerates over interactions
… Lots of questions around how we can gather statistics on them
.png)
… Resource Timing - used to track that, but found that it wasn’t very useful
… So stopped tracking it for interactions
… challenges with initiator type inconsistencies
… Session wide interactions - logged through the entire life of the page
… Trying to capture most interactions but not all
.png)
… Used to measure slow session metric
… That metric meant that teams tried to improve the metric when it regressed, but it was hard to explain and hard to attribute
.png)
… Moving towards looking at INP and monitoring that, but it’s still early days
… No session-wide frame rate API
… Slowest interaction may not represent faster but still slow interactions
.png)
… Best way to define frame rate? Want to discount idle time
Andy: Question in the chat around design interactive and design rendered and how they’re measured. Using rAF and setTimeout to instrument rendering opportunities
… on crashes. Find that users have crashes on native mobile apps.
… Problems in the design can cause the appl to “refresh” at random
.png)
… Found that crashes are easy to explain to internal teams
… Find they are typically OOM issues
… Investigate this based on user reports
… Attempt changes and measure crashes going down
… Rely on native wrappers to get those reports, but mobile web is seeing something similar
… Desktop app still has low usage, so not much data there
… Saw the reporting API but unclear if it’d give them the info needed
.png)
… Want ElementTiming on divs
… Want to get recommendations on frame rates and how to measure them
… consistent crash analytics
Yoav: Regarding crashes, two questions.
... 1) You mentioned you looked a bit at crash reporting (Reporting API), but you're not sure if it answers your needs?
... 2) Have you looked into memory reporting? API in Chromium for measuring memory in cross-origin isolated pages. Is this feasible to try out?
Andy: A bit of experience, not an area I worked on specifically. For measuring memory, one of the problems we have is although we're starting to record memory usage metrics, one of the problems is we don't know where the limit is. Device doesn't want to tell us anything about itself. Although we track memory, and from debugging locally, 500MB was fine while going up to and sustaining above 700MB would reliably trigger a crash. Hard to get consistent results.
... The other aspect is when we have reporting in our web code, if a crash is about to happen, the app is probably having a really bad time. Can be hard to record reasonable metrics at that point.
... One of the problems we've had is in creating at timeline of interactions, we'd get an event for X and Y, but Z action would cause the app crash and the web code stopped working at the point of the crash.
... Native cordova wrapper gets details from the webview crash
Yoav: If I understand correctly, you did try crash reporting using Reporting API headers but it was hard to attribute to specific page events
Ben: We haven't using Reporting API itself yet. Using WebView crash analytics.
Yoav: OK
Michal: Thanks for the presentation, you answered most of my questions as you went along
... You lop a lot into the interactions bucket, I wanted to know if you feel they're logically related. What I saw was discrete interactions, continuous interactions which are also running animations. Is that always the case?
... Then you had session-based interactions, an overall performance metrics. Long Tasks, etc. Predictor of interaction performance maybe? An umbrella term?
Ben: Framing them all under interactions may not be the best categorization, but post-load activities. Also some session-wide metrics. Presentation didn't mention that Slow Editor Session metric (using Long Tasks) was straightforward to do. Measuring every individual interaction is a process we're going through, for performance and reliability.
... Animations occurring during discrete interactions is something we're still curious around, and same when a user interacts, what are the other things going on.
... Working with offline team on these
... Some other buckets w.r.t. categorizing interactions we've toyed with, i.e. async operations when users download something like a PDF. When they do that action they're waiting for a long file download to finish.
Michal: Other big question was around discrete interactions. INP only mentions the next paint after an interaction. So time after sync handlers ran to first ability to provide feedback. Currently no direct way to mark arbitrary work and presentation after that. You mentioned a polyfill to deal with that.
... You also mentioned Soft Nav. For most of these async operations, does it get encoded in the URL with a route change, and would the next Contentful Paint capture that? Or for PDF example, would application be doing other things, async operation streamlined and parallel and you need another mark? Or is it a mix of all of these?
Ben: URL doesn't update in case of the editor for these operations. e.g. changes to the editor.
... Soft Nav wouldn't work for the editor, but may for the other pages
... We have quiet a few interactions where there are no route changes
Andy: The main interactions we think about in the editor, when thinking of UX. Is clicking and dragging elements around, things we really notice when dragging around in design, we want it super responsive. That's the kind of thing we're really focusing on when thinking of interactions.
... Those don't change the URL at all
Andy Luhrs: On crash reporting side of things, Edge put a proposal for including JS call-stacks for hangs (not OOMs). I don't know if it's been talked about much. https://github.com/WICG/crash-reporting/issues/12
... OOM is a different beast than hang or crash
... Another issue in crash reporting repo, whether it should be taken on by webperf WG
Yoav: Crash Reporting in WICG, Reporting API in WG. No consensus last time to adopt it.
Nic: Maybe a topic for TPAC as well?
Andy: Open to feedback on that idea. Problem we've seen w/ people looking at crashes, it doesn't provide enough context for crashes, etc.
Yoav: Do you know for OOM, since it was the main reason here, do we report amount of memory consumed by crashing renderer or along those lines?
Andy: OOM is just OOM and user-agent, nothing else
... Probably low-hanging fruit there for making it better
Yoav: Privacy conversations to be had for what we can-or-can't expose there
... Probably do better than nothing.
... One more thing, you mentioned you use rAF a lot to determine next render opportunity. This can be inaccurate and could be triggering rendering even if one wasn't planned.
... Traditionally we haven't been able to expose paints due to visited links/etc. But we have plans to partition that cache, so it may open opportunities to expose random paint points.
Michal: Problem with rAF is long-running polling during idle periods, where you're telling browser you're doing rendering, but you're just doing accounting. Affect on battery, performance, you're using your frame slot early that can no longer render in that vsync window. Affects idle callbacks, etc.
... But if you're only using it because you're applying a render update, you want to listen to that render, I'm less concerned
... There are other patterns you could use, e.g. double rAF
... Then you know paint effects have left the main thread
... For long-running smoothness, I know there were previous privacy concerns. But maybe long-term aggregates.
... e.g. Long Animation Frames
... Progress in this area and I'm keen to see where we can get
Andy: Double rAF is interesting. During page load, through instrumenting editor, and setting breakpoints, found rAF wasn't really giving us what we want when the component was loaded. We find we're taxing the browser a lot during page load. Browser is blocked for most of the time executing JS, so rAF not giving us when component was loaded, browser was struggling to keep up.
... setTimeout() gave us a much better metric
... Paradigm to work on is not letting perfect get in the way of better
... Some of the interaction metrics, when reducing to one number, main+stddev as opposed to report on multiple aspects of that metric, use a headline number instead
... Gives us more in terms of driving change
Andy: Thanks!!