Fergal: laptop spinning up fans, finding processes hitting 100% CPU doing nothing
… Chrome wants to change UI to be more frequently written in JS and HTML and need to make sure we’re not doing anything when we shouldn’t
… Nothing in JS that can help keep track if we’re doing nothing or not
… Some things should never be idle, but it’s very easy to burn CPU/GPU doing nothing
… Drains battery and heats up devices
… Loops that are easy to miss
… Idleness == time spent not doing work
… Want to know what initiated work
… Goal: APIs to use in the wild to detect and debug unwanted work
… There are different subsystems that can do work: JS, CSS, rendering, network, storage
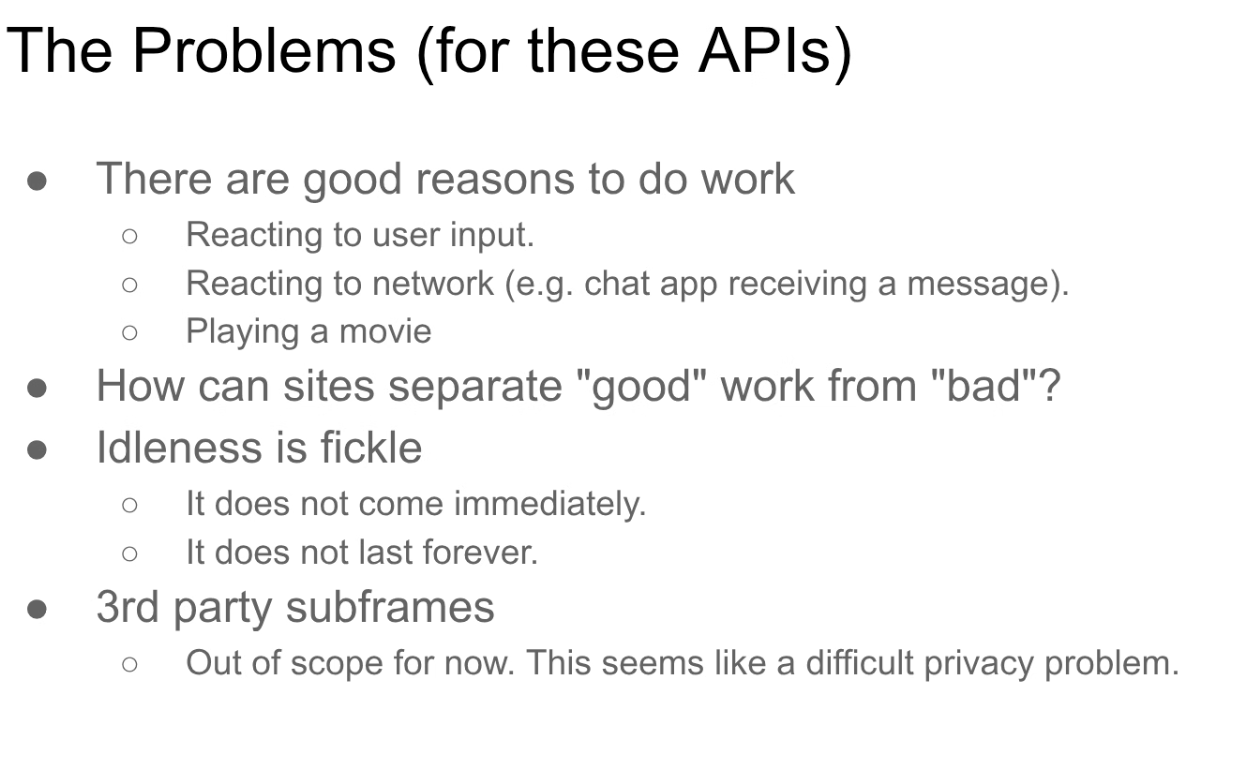
… Shouldn’t count user initiated work as “unwanted”
…
… need to get to “idle” sooner and stay there longer. Need to know what kicked of the work, not a full profiler
… prior work: battery usage API, exposure of “initiators” in RUM API
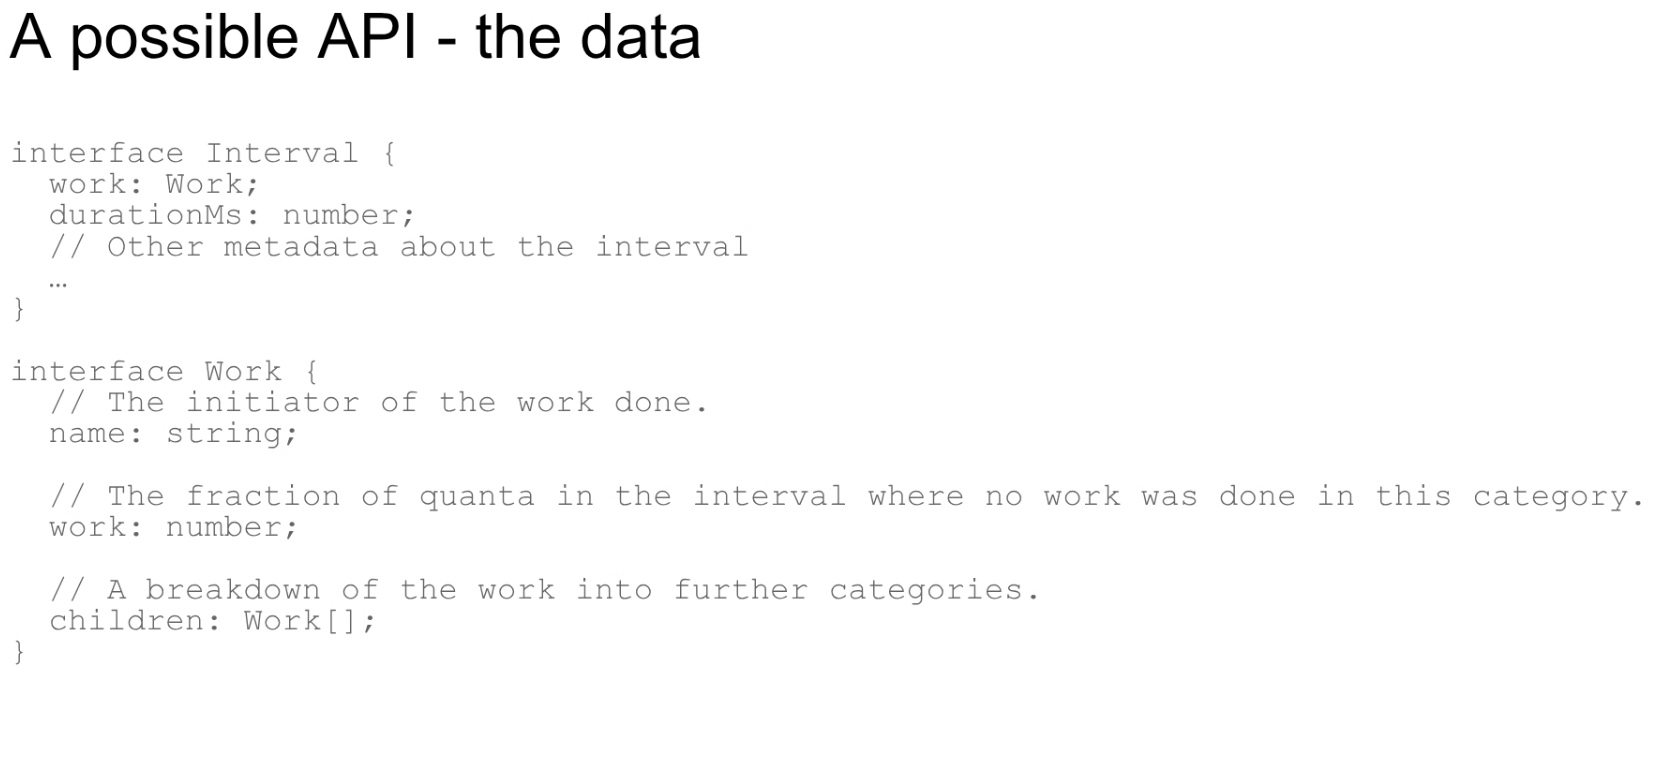
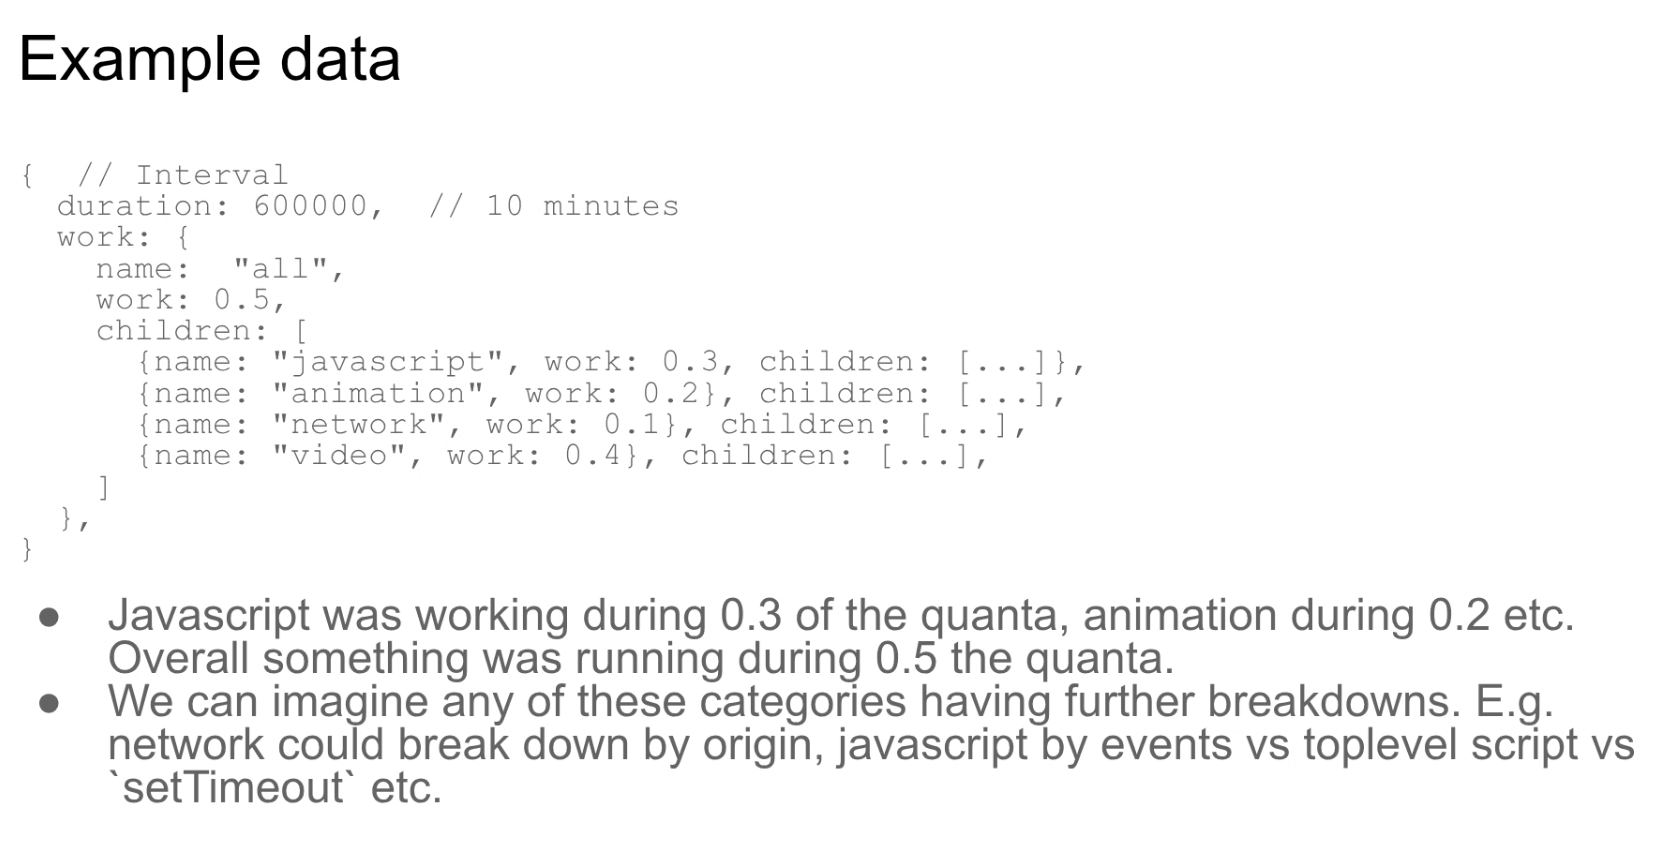
… High level proposal: define quanta of work done during a time period and breakdown the initiators
…
…
… can imagine JS to be broken down to “top level script”, “events”, “timeout”, etc
…
Jacob: API shape doesn’t say what made the page idle (e.g. the user switched away)
Fergal: Idle just means you’re not doing any work - e.g. no JS runs, etc
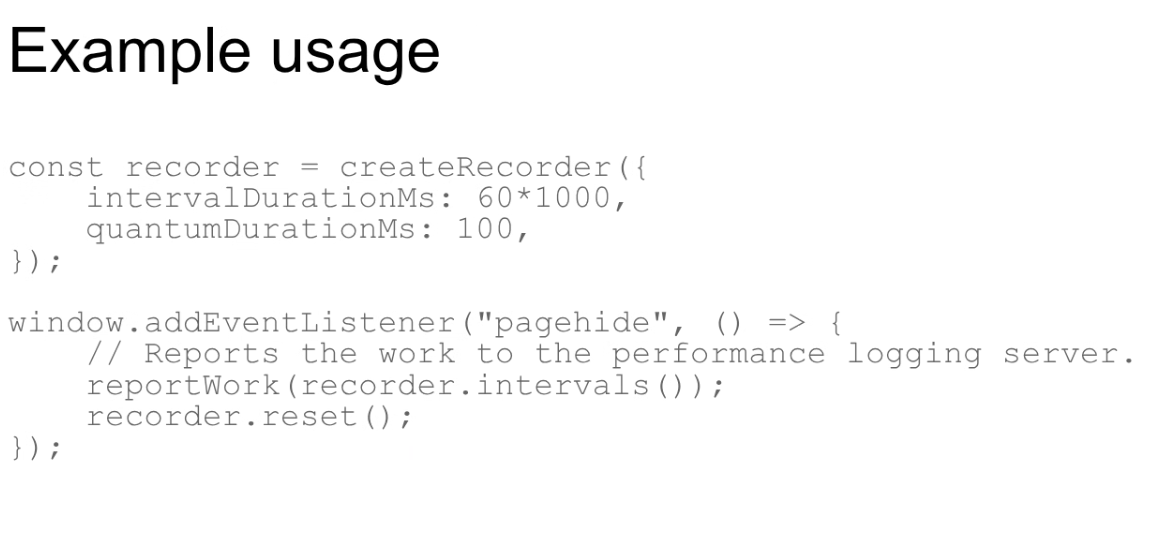
… You could worry about e.g. visibility change and see if you get a zero “busy” time while being non-visible
Jacob: So basically - when am I interested in the idle data?
Fergal: yeah
Elad: Is this polyfillbale if all the code the website has is wrapped in measurement?
Fergal: For JS yes. Not for CSS animations and other bits of the DOM. (e.g. work triggered by DOM changes when the frame is sent to the compositor - stylecalc, relayout, etc).
Elad: So additional work that would otherwise be invisible. CSS animations is another
Bas: Mozilla folks looked at this. Got feedback that the problem of “a website is not doing much but doing a lot” exists. But indicated that this API is unlikely to be used by many websites other than very large ones. Tricky to integrate in libraries.
… Indicated that a preferred shape would be a way for a website to tell the browser that it doesn’t expect to do much until the next interaction, etc. Browsers can then deprioritize work or warn about it. Curious about your thoughts
Fergal: Most websites, unless the user interacts with them, they shouldn’t be doing work. So I think that just knowing that your site is often using 10% cpu, it’s a huge signal that something wrong
… Would be nice to have a reverse signal, but seems difficult to do that kind of signal when your site is built from many components
Bas: But it can be a way to control the 3P cruft
Fergal: I’ll think about it
Matt: I’d definitely would be interested in that. Especially for soft navigation as a way to see they are still doing work after they are “done”. Hard to reconcile what performance observer is eposing now. Seems related to LoAF, so may be possible to unify in some way.
… with the work completed, want to know if everything is done
… There’s also “critical” vs. “non-critical” work
Fergal: I’d love to understand how you’re using the existing API
Matt: We’re looking at POs and find a “quiet window”. It’s not perfect because Long Tasks have 50ms window. This API can help
Fergal: LT and LoAF focus on long tasks, but waking the CPU every 10ms is invisible
… LT doesn’t catch that
Matt: Recently saw animation scheduler running frames, where none was long enough to trigger long tasks
NoamH: We do something similar to what Matt described, but for a different purpose. We try to detect idle periods so that we can do work without bugging the user.
… What’s the gap between this and existing APIs: profiler API, etc?
Fergal: Haven’t looked at the profiler API. It’s a sampling profiler
NoamH: Could work for large scale
Fergal: But you won’t be able to detect rogue animations at early phases of deployments
NoamH: Could be. Also I think Performance Observer would be a good fit
Jase: This is great. Had issues like this in the past and only found them in devtools. Would definitely use something like that. Also support the PerfObserver
… Also feels related to the profiler.
Yoav: In terms of profiler, one of the biggest problems for deployment there’s a clear slowdown so you want to effectively sample % of users getting it. Requires a lot of scale or you’re slowing down the general population.
… This feels like something lightweight than a full profiler. Regardless of shape, people need to be able to enable w/out worrying about performance costs.
Fergal: Who started the JS tasks is what you care about.
Yoav: We have that in LoAF and to some extent in soft navigations without overhead
NoamH: Profiler has to be used in sampling way
… Also hard to know what is the right amount of idleness that is good, depends on site characteristics. Shopping different than Netflix page.
… How do you come up with the right balance?
… Fraction per minute?
… Total amount of idleness detected
Fergal: Not sure you can rate things. A site can see if it’s regressing or getting better.
… Allows you to confirm you’re hitting what you expect
… Netflix knows its playing media but shouldn’t be spinning JavaScript
Barry: Wrapper scripts sometimes give the wrong initiator for e.g. LoAF, wrapping or monkey-patching
… Never solved that with LoAF
Fergal: Or maybe people rewrote?
Barry: For measurement, wrapping used
Nic: Where to continue for discussion? Explainer repo?
Fergal: I’ll create for later
Yoav: Great discussion for TPAC
Eriko: Jankiness measurement API
… want to keep the main thread responsive, so every task sub 50 ms
… Want to catch lower thresholds as well
… need to know exactly what’s running. No existing tools
… LT and LoAF are a bit different. 50ms threshold. LoAF provides data after the frame finishes
… Need a summary after the task ends with precise execution
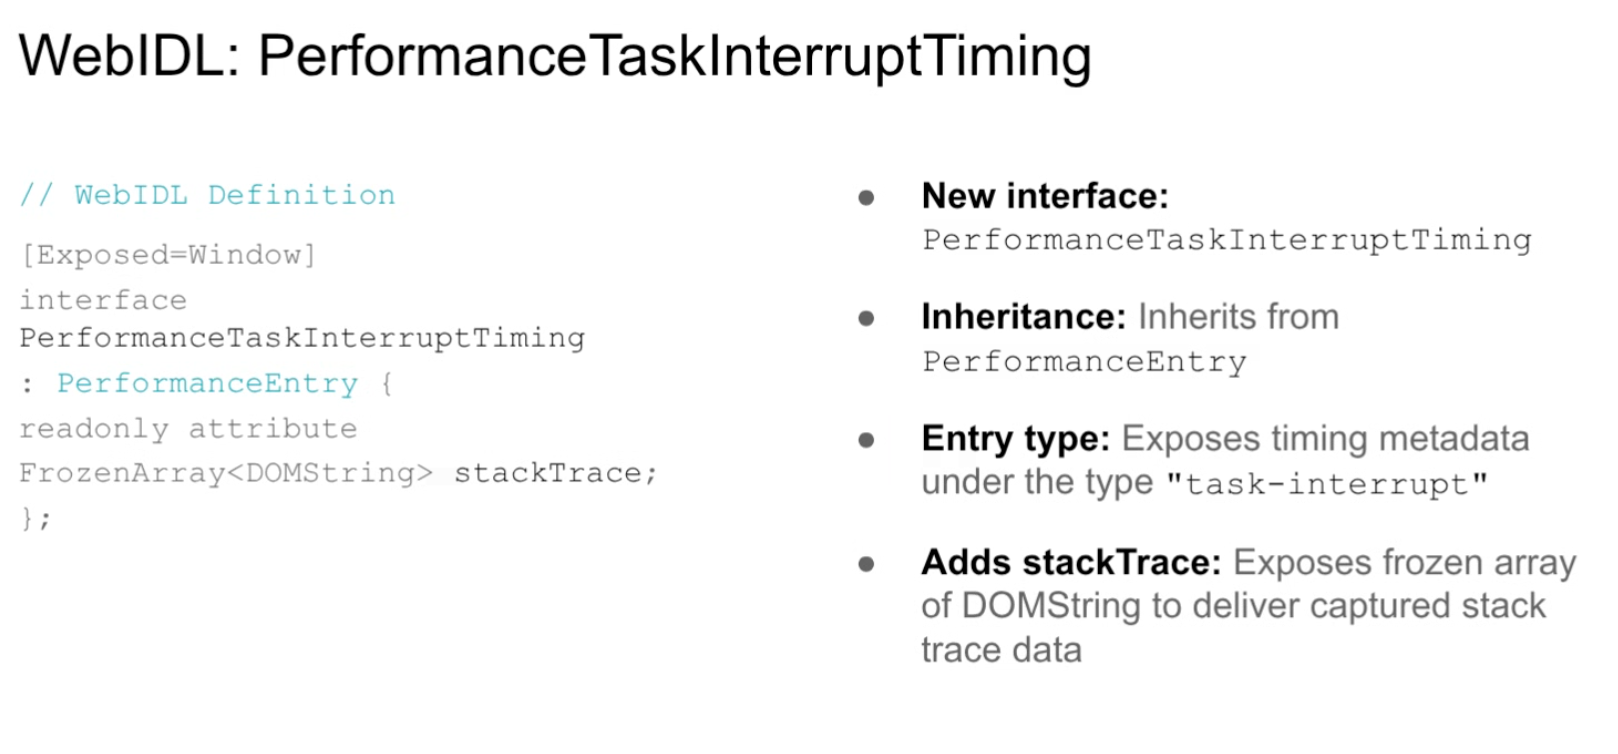
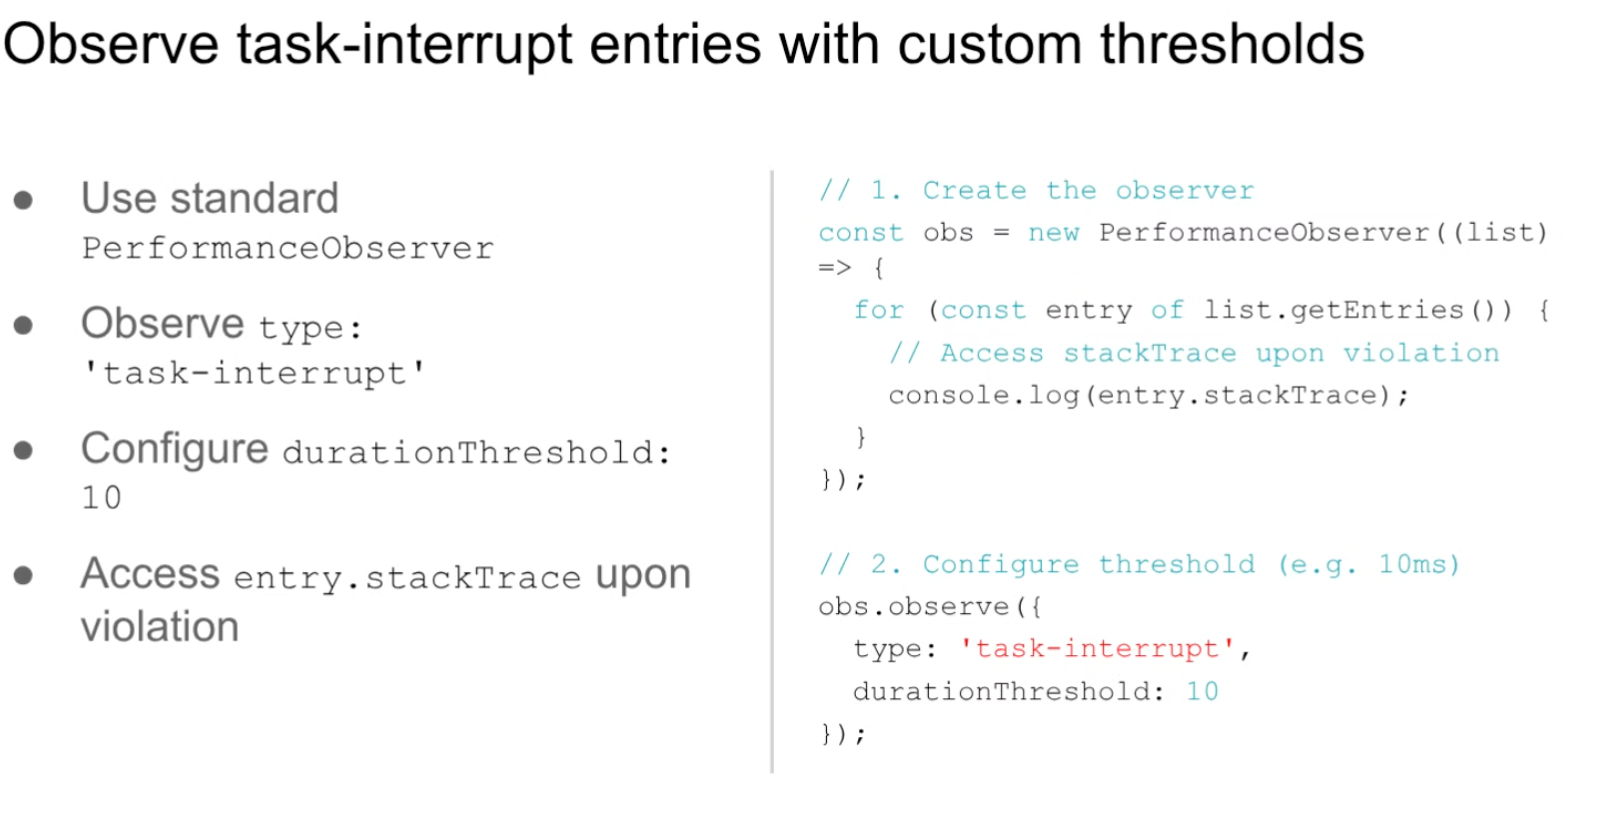
… Want to configure low thresholds, capture JS stack traces mid-execution, ~0 perf overhead
…
…
… There are semantic differences here between LT and LoAF. Want to measure short tasks before the frame occurs
… Need point in time, mid-execution intervention opportunity
… JS only, no CSS, Layout, Paint
… could be noisy, and interrupting the JS engine has costs on its own
… Exposing a raw JS stacktrace can be a security risk
… we can filter non-CORS cross origin frames, expose only entry points called by first party script
… Questions: is truncation sufficient, is the overhead acceptable & naming..
Yoav: You’re talking about interrupting the JS engine mid-task, but also PerformanceObservers (async, registered an observer), how does that work?
Fergal: Interrupt occurs and gets the stack trace, not when the Observer gets the event
Yoav: Interrupt gets the stack trace, continues task, later PO fires. OK.
Matt: With this API, is it proposed because LongTask doesn’t have the right context or configurability?
… If we can change the 50ms to something else and have more context, does it solve the same problem here?
Eriko: Goal is to be able to reduce the threshold, lower than 50ms, 5ms. I want the JS stack trace, helpful for understanding why.
Matt: Does it need a stack trace? Could it be just the initiator? Seems very similar to Long Tasks event. Can it be extended?
Eriko: Entrypoints and stack traces can provide different information
… Long Tasks is defined mainly for tasks > 50ms, whereas this is smaller changes the semantics
Matt: Seems like 50ms could be a default and configurable from there
… Configure 50ms would be great. Stack-trace I’m wary of, context surface that’s partially available
Fergal: LongTasks API only consider single tasks or when it’s a run
Barry: LT considers single tasks, LoAF considers single frames
… LoAF looks at 50ms frames but considers scripts up to 5ms or larger, so you could have N 5ms scripts and you get entrypoints
… Feels weird that an observer is no longer observing but now also interrupting and doing things
… For EventTiming you can configure the default
Fergal: We really want to gauge whether people really want this
Matt & Marko: +1 to be able to configure the 50ms threshold in long tasks
Barry: NoamR did a lot of work w/ LoAF. Goal of low-overhead vs. stack trace etc conflicts a bit.
… I do worry that are contradictory and there’s always some overhead
Fergal: I don’t know what the actual total time to take a stack trace is, think it’s small compared to >= 5ms task
Yoav: I think it’s worthwhile to prototype and evaluate the cost of taking stack traces. Something that was explored in the past and concluded it was expensive. Good to quantify.
Fergal: Idea here is that you want to not ever get these, and so you only get these stack traces if something is going wrong and tasks are over 5ms
Yoav: But when things are going wrong, this can exacerbate them
Barry: 5ms doesn’t seem as long
Fergal: I think 5ms in a JS tasks without yielding seems long?
Bas: Not on the current web
Barry: Get the cheap entrypoint function for 5ms, after N get full stack trace, etc.
Yoav: More discussion at a future call or TPAC?
… Sounds like a lot of appetite for something like this